Study Overview
This study evaluates the Scout Terra EREV's 100 kW generator across various towing configurations and demanding drive cycles.
- Vehicles Tested: 7 configurations (base + 6 trailer combinations)
- Drive Cycles: 4 cycles (Davis Dam, I-70 Climb, Highway 75 MPH, US06)
- Starting SOC: 100% and 50%
- EREV Mode: Blended (generator assists at high power demand)
⚠️ Generator Capacity Warnings
- Boxy Moving Trailer: Requires 144.9 kW at 75 mph (exceeds 100 kW generator)
- Boxy Long RV: Requires 165.6 kW at 75 mph (exceeds 100 kW generator)
- Livestock Trailer: Requires 192.1 kW at 75 mph (exceeds 100 kW generator)
- Boxy Moving Trailer: Max sustainable speed on generator alone: 65 mph
- Boxy Long RV: Max sustainable speed on generator alone: 62 mph
- Livestock Trailer: Max sustainable speed on generator alone: 58 mph
📊 Table 1: Vehicle Configurations
| Configuration | Mass (kg) | Mass (lb) | Frontal Area (m²) | Cd | Crr | Generator (kW) |
|---|---|---|---|---|---|---|
| Base (No Trailer) | 3175 | 7001 | 3.4 | 0.35 | 0.010 | 100 |
| Boxy Moving Trailer | 5200 | 11466 | 6.0 | 0.85 | 0.015 | 100 |
| Boxy Long RV | 5875 | 12954 | 6.5 | 0.90 | 0.015 | 100 |
| Streamlined RV | 4975 | 10970 | 5.0 | 0.55 | 0.015 | 100 |
| Open Car Hauler | 5650 | 12458 | 4.0 | 0.75 | 0.015 | 100 |
| Flatbed Utility | 4075 | 8985 | 3.5 | 0.45 | 0.015 | 100 |
| Livestock Trailer | 5875 | 12954 | 7.0 | 1.00 | 0.015 | 100 |
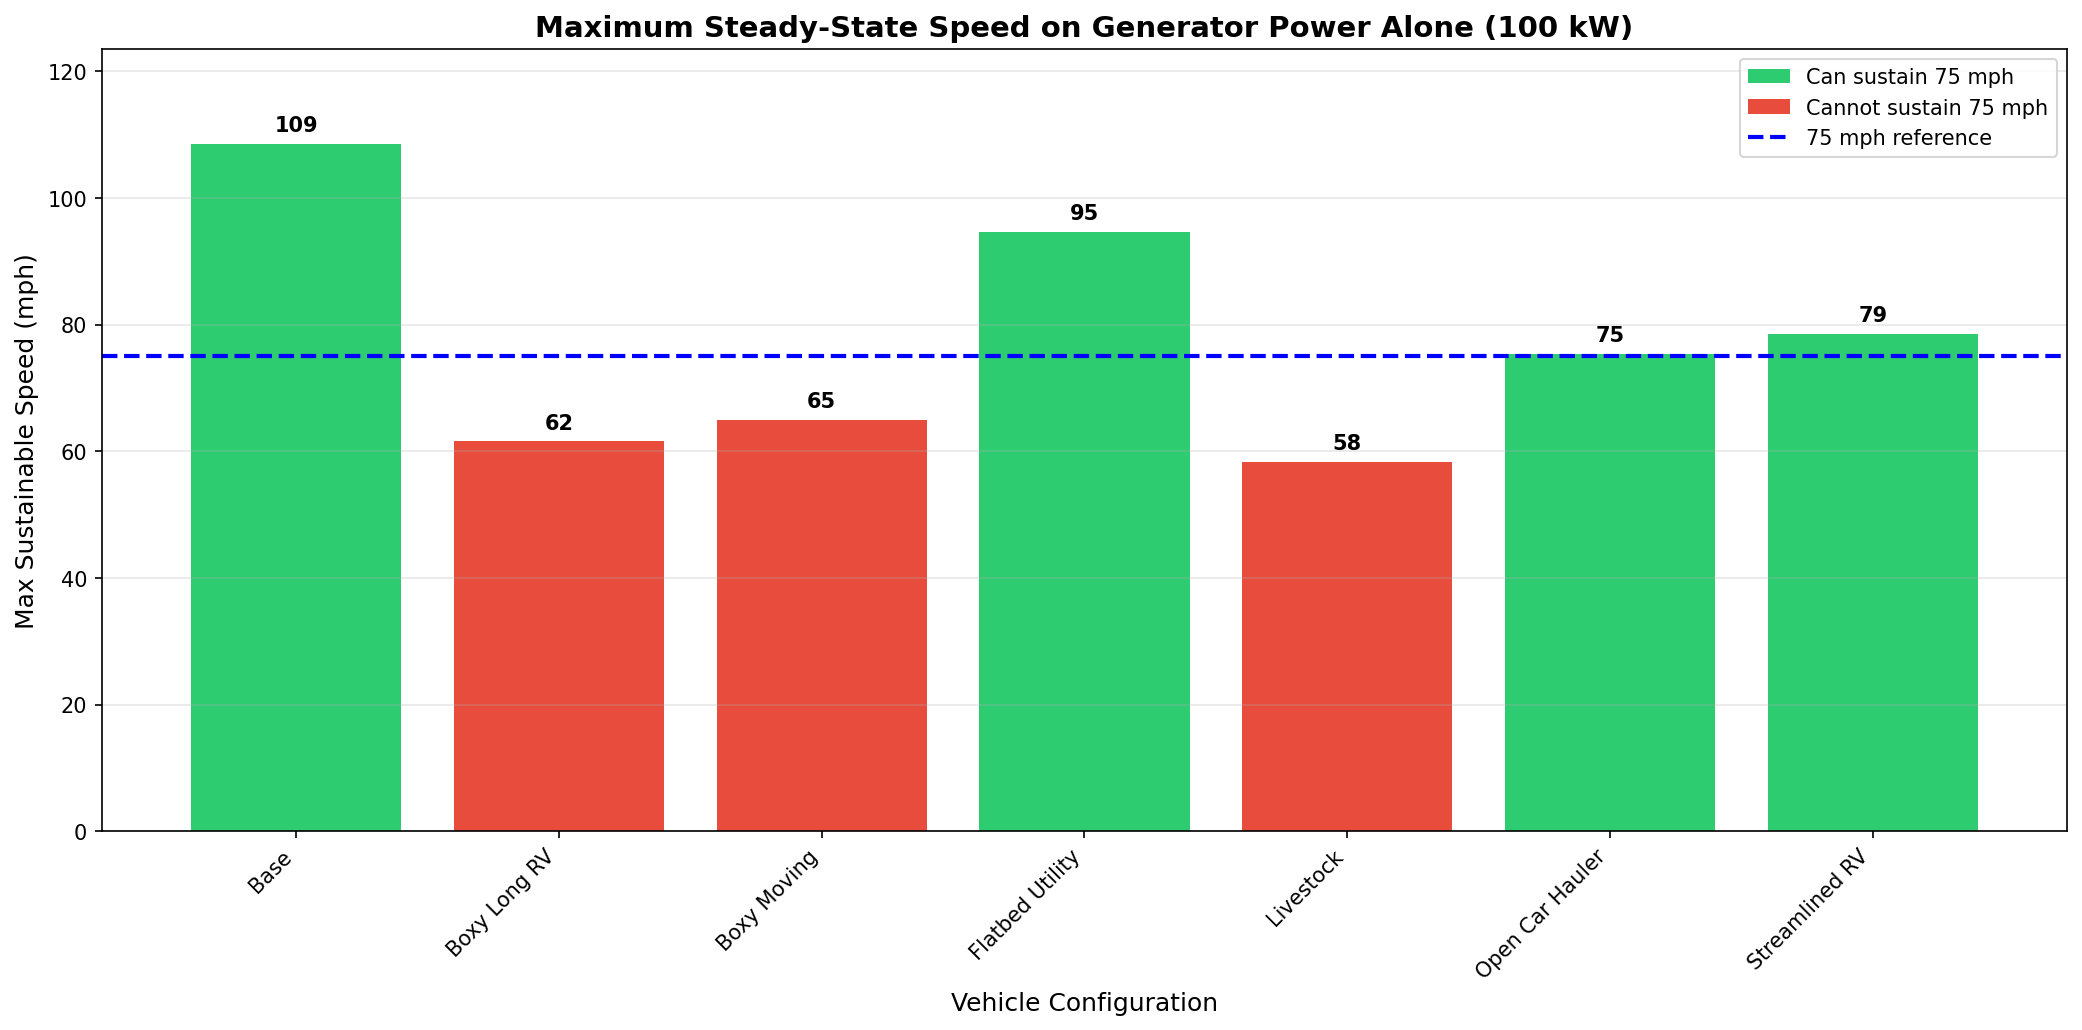
🏎️ Table 2: Maximum Generator-Only Sustainable Speed
Maximum steady-state speed achievable on flat ground using generator power (100 kW) alone, with no battery assist.
| Configuration | Max Speed (mph) | Power at Max Speed (kW) | Power at 75 mph (kW) | Can Sustain 75 mph? |
|---|---|---|---|---|
| Base (No Trailer) | 108.6 | 100.0 | 39.4 | Yes ✓ |
| Boxy Long RV | 61.6 | 100.0 | 165.5 | No ✗ |
| Boxy Moving Trailer | 64.9 | 100.0 | 144.9 | No ✗ |
| Flatbed Utility | 94.7 | 100.0 | 58.0 | Yes ✓ |
| Livestock Trailer | 58.3 | 100.0 | 192.1 | No ✗ |
| Open Car Hauler | 75.4 | 100.0 | 98.6 | Yes ✓ |
| Streamlined RV | 78.5 | 100.0 | 89.5 | Yes ✓ |
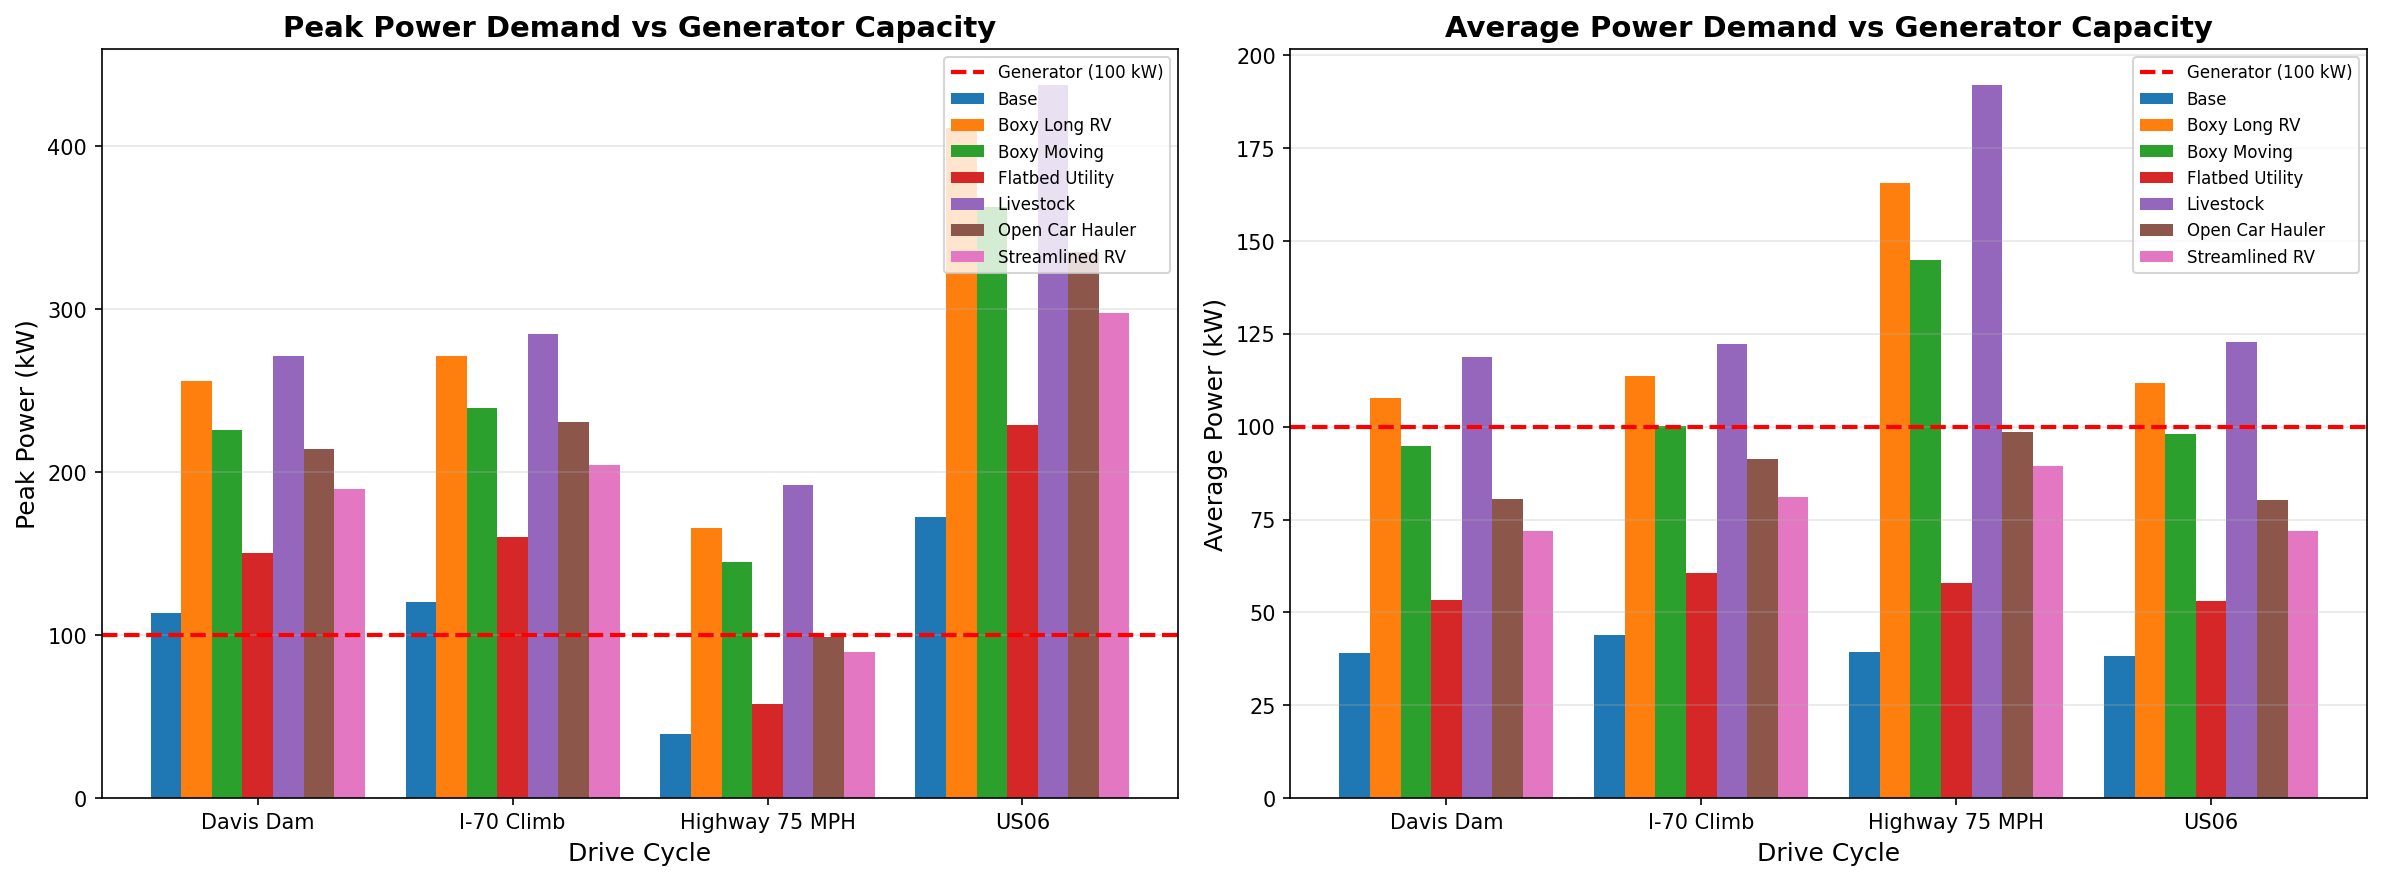
⚡ Table 3: Power Demand Summary
Peak and average power demand at the wheels. Values exceeding 100 kW are highlighted.
| Configuration | Davis Dam | I-70 Climb | Highway 75 MPH | US06 | ||||
|---|---|---|---|---|---|---|---|---|
| Peak (kW) | Avg (kW) | Peak (kW) | Avg (kW) | Peak (kW) | Avg (kW) | Peak (kW) | Avg (kW) | |
| Base (No Trailer) | 113.3 | 39.0 | 120.3 | 43.9 | 39.4 | 39.4 | 172.4 | 38.2 |
| Boxy Long RV | 256.0 | 107.8 | 271.2 | 113.7 | 165.6 | 165.6 | 411.2 | 111.7 |
| Boxy Moving Trailer | 225.7 | 94.8 | 239.3 | 100.1 | 144.9 | 144.9 | 362.3 | 98.0 |
| Flatbed Utility | 150.1 | 53.4 | 159.9 | 60.7 | 58.0 | 58.0 | 228.6 | 53.0 |
| Livestock Trailer | 271.1 | 118.8 | 284.4 | 122.2 | 192.1 | 192.1 | 437.6 | 122.9 |
| Open Car Hauler | 214.0 | 80.6 | 230.5 | 91.2 | 98.6 | 98.6 | 335.1 | 80.2 |
| Streamlined RV | 189.5 | 72.0 | 204.4 | 81.2 | 89.5 | 89.5 | 297.7 | 71.9 |
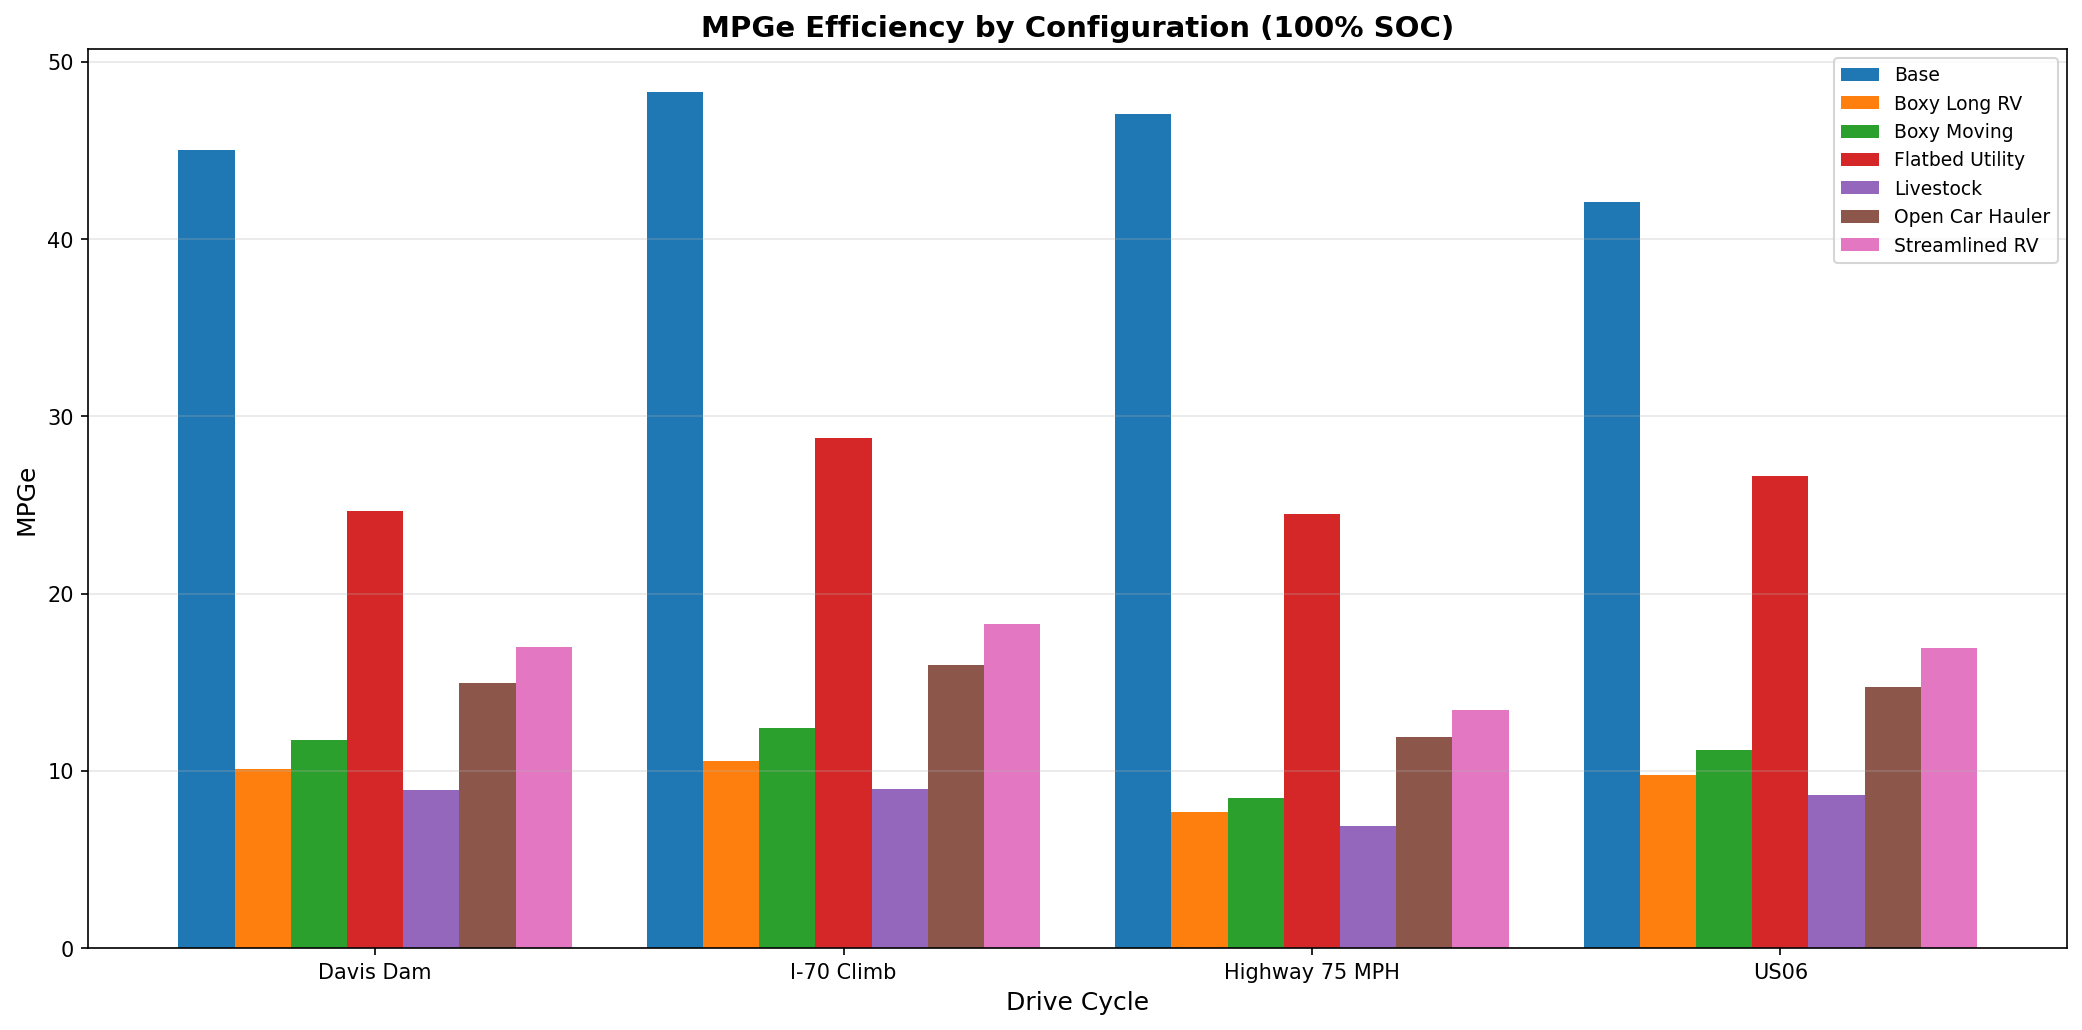
🔥 Table 4: Efficiency Results 100% SOC
Overall mi/kWh shows total energy efficiency (battery + fuel combined). This is the most accurate measure of drive cycle energy intensity.
| Configuration | Davis Dam | I-70 Climb | Highway 75 MPH | US06 | ||||||||
|---|---|---|---|---|---|---|---|---|---|---|---|---|
| Overall mi/kWh | MPG | MPGe | Overall mi/kWh | MPG | MPGe | Overall mi/kWh | MPG | MPGe | Overall mi/kWh | MPG | MPGe | |
| Base (No Trailer) | 1.34 | 337.3 | 45.0 | 1.43 | 291.2 | 48.3 | 1.40 | 149.1 | 47.1 | 1.25 | 171.6 | 42.1 |
| Boxy Long RV | 0.30 | 15.9 | 10.1 | 0.31 | 15.5 | 10.6 | 0.23 | 10.1 | 7.7 | 0.29 | 15.0 | 9.8 |
| Boxy Moving Trailer | 0.35 | 19.1 | 11.7 | 0.37 | 19.2 | 12.4 | 0.25 | 10.8 | 8.5 | 0.33 | 17.4 | 11.2 |
| Flatbed Utility | 0.73 | 50.7 | 24.7 | 0.85 | 69.3 | 28.8 | 0.73 | 38.0 | 24.5 | 0.79 | 65.6 | 26.7 |
| Livestock Trailer | 0.26 | 13.6 | 8.9 | 0.27 | 12.4 | 9.0 | 0.20 | 9.6 | 6.9 | 0.26 | 13.1 | 8.7 |
| Open Car Hauler | 0.44 | 26.2 | 15.0 | 0.47 | 26.2 | 15.9 | 0.35 | 14.4 | 11.9 | 0.44 | 24.9 | 14.7 |
| Streamlined RV | 0.50 | 31.0 | 17.0 | 0.54 | 31.7 | 18.3 | 0.40 | 16.7 | 13.5 | 0.50 | 30.5 | 16.9 |
🔥 Table 5: Efficiency Results 50% SOC
Overall mi/kWh shows total energy efficiency (battery + fuel combined). This is the most accurate measure of drive cycle energy intensity.
| Configuration | Davis Dam | I-70 Climb | Highway 75 MPH | US06 | ||||||||
|---|---|---|---|---|---|---|---|---|---|---|---|---|
| Overall mi/kWh | MPG | MPGe | Overall mi/kWh | MPG | MPGe | Overall mi/kWh | MPG | MPGe | Overall mi/kWh | MPG | MPGe | |
| Base (No Trailer) | 0.94 | 53.1 | 31.8 | 0.98 | 50.2 | 33.0 | 0.83 | 31.5 | 27.9 | 1.25 | 171.6 | 42.1 |
| Boxy Long RV | 0.23 | 8.4 | 7.6 | 0.25 | 9.7 | 8.5 | 0.22 | 9.6 | 7.5 | 0.29 | 15.0 | 9.8 |
| Boxy Moving Trailer | 0.26 | 9.9 | 8.8 | 0.28 | 10.2 | 9.3 | 0.24 | 9.8 | 8.1 | 0.33 | 17.4 | 11.2 |
| Flatbed Utility | 0.57 | 25.6 | 19.3 | 0.61 | 26.5 | 20.7 | 0.53 | 19.5 | 18.0 | 0.79 | 65.6 | 26.7 |
| Livestock Trailer | 0.21 | 8.2 | 7.1 | 0.23 | 9.1 | 7.8 | 0.20 | 9.5 | 6.8 | 0.26 | 13.1 | 8.7 |
| Open Car Hauler | 0.33 | 13.2 | 11.3 | 0.37 | 14.3 | 12.3 | 0.30 | 10.6 | 10.1 | 0.44 | 24.9 | 14.7 |
| Streamlined RV | 0.38 | 15.3 | 12.8 | 0.41 | 16.4 | 13.9 | 0.33 | 11.8 | 11.2 | 0.50 | 30.5 | 16.9 |
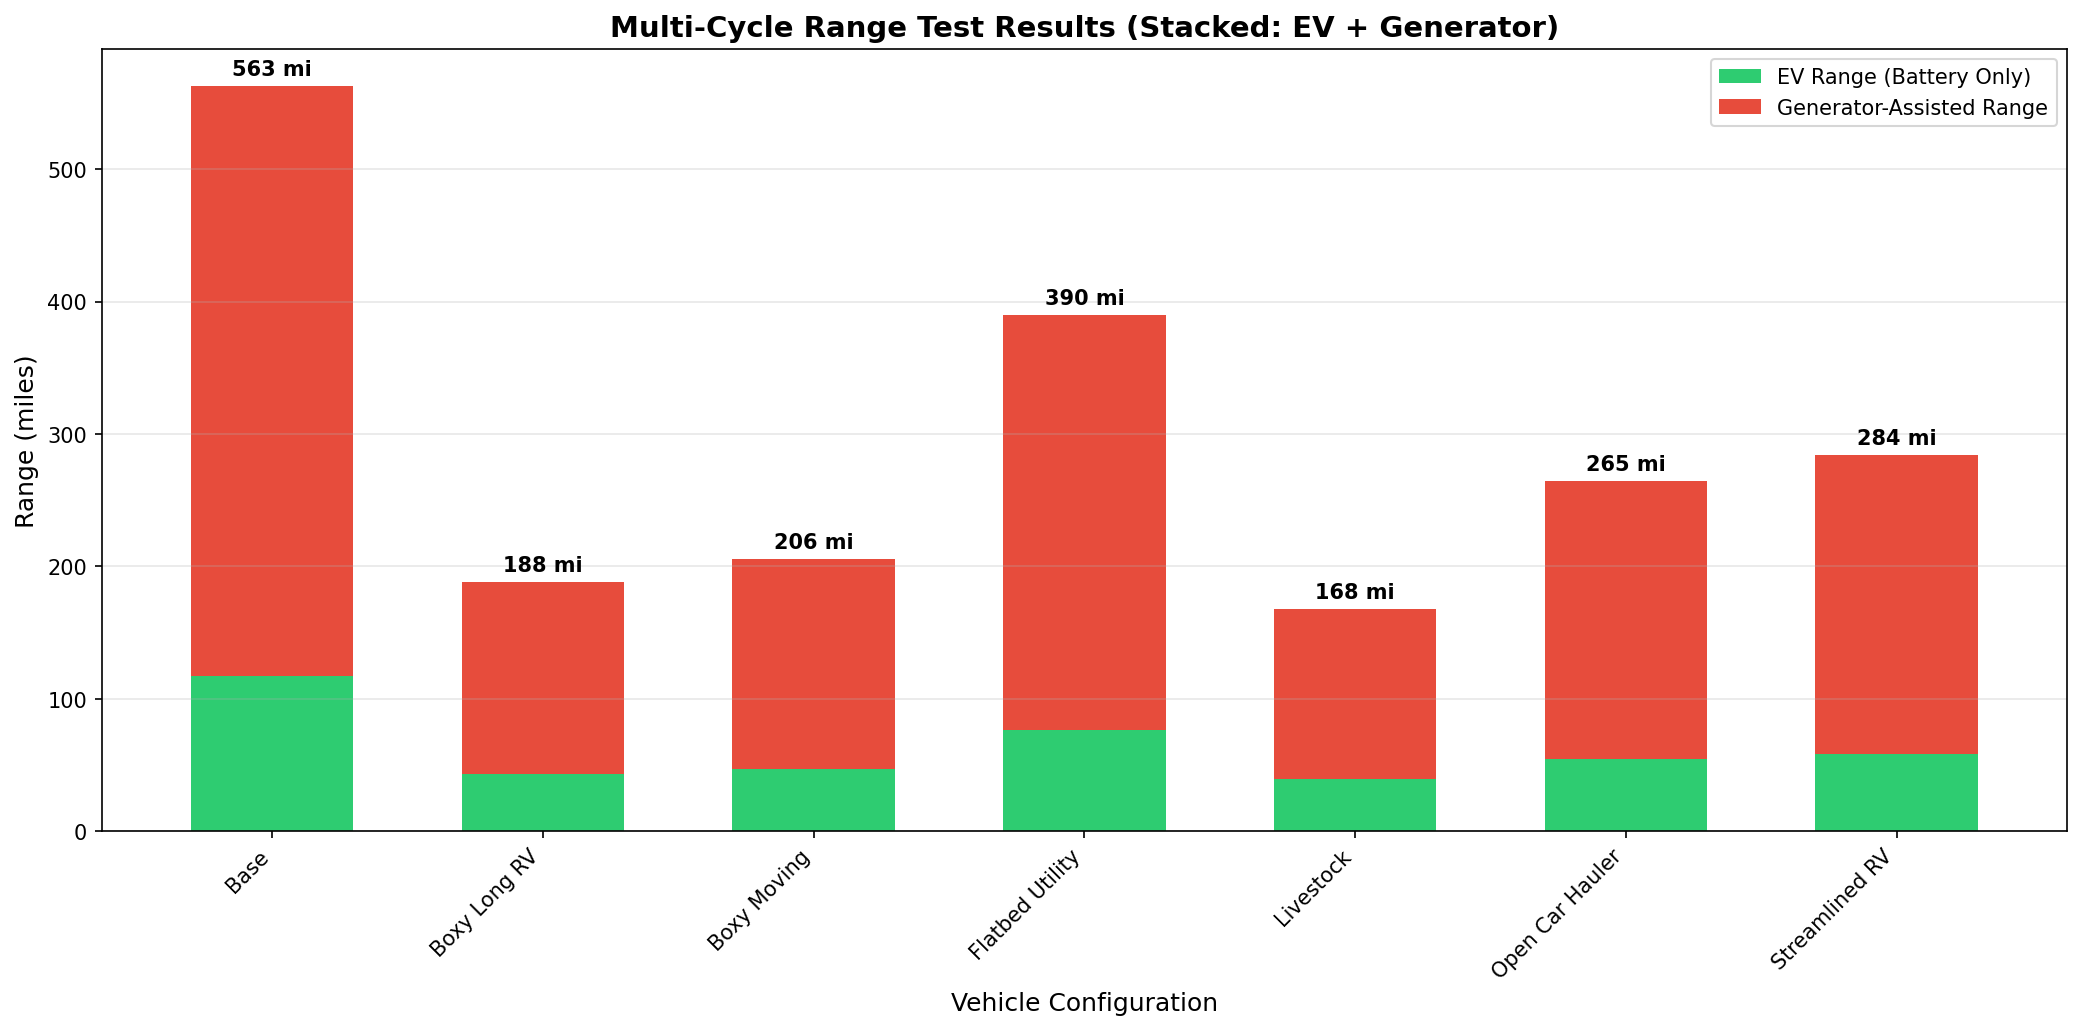
🛣️ Table 6: Multi-Cycle Range Test Results (100% SOC)
EPA-style multi-cycle range test (4×UDDS + 2×HWFET + 2×Constant 70mph).
| Configuration | Total Range (mi) | EV Range (mi) | Generator Range (mi) | Fuel Used (gal) | MPGe |
|---|---|---|---|---|---|
| Base (No Trailer) | 563 | 117 | 446 | 15.0 | 26.1 |
| Boxy Long RV | 188 | 43 | 145 | 15.0 | 9.8 |
| Boxy Moving Trailer | 206 | 47 | 159 | 15.0 | 10.7 |
| Flatbed Utility | 390 | 77 | 313 | 15.0 | 18.6 |
| Livestock Trailer | 168 | 40 | 128 | 15.0 | 8.7 |
| Open Car Hauler | 265 | 54 | 210 | 15.0 | 13.3 |
| Streamlined RV | 284 | 58 | 226 | 15.0 | 14.2 |
🚗 Table 7: 75 MPH Steady-State Range Test (100% SOC)
Range at constant 75 mph on flat ground starting from 100% SOC. Peak power values exceeding 100 kW generator capacity are highlighted.
Note: "Generator-Assisted Range" shows miles traveled while generator is running. When power demand exceeds 100 kW, the battery supplements the generator. All configurations deplete their 15-gallon fuel tank at roughly the same rate because the generator output is capped at 100 kW, but high-drag configurations would be speed-limited to "Max Gen Speed" after battery depletion.
| Configuration | Total Range (mi) | EV Range (mi) | Gen-Assisted Range (mi) | Peak Power (kW) | Exceeds 100kW? | Max Gen Speed (mph) |
|---|---|---|---|---|---|---|
| Base (No Trailer) | 428 | 84 | 344 | 39.4 | No ✓ | 109 |
| Boxy Long RV | 162 | 20 | 142 | 165.6 | Yes ⚠️ | 62 |
| Boxy Moving Trailer | 165 | 23 | 142 | 144.9 | Yes ⚠️ | 65 |
| Flatbed Utility | 302 | 57 | 245 | 58.0 | No ✓ | 95 |
| Livestock Trailer | 159 | 17 | 142 | 192.1 | Yes ⚠️ | 58 |
| Open Car Hauler | 191 | 34 | 158 | 98.6 | No ✓ | 75 |
| Streamlined RV | 207 | 37 | 170 | 89.5 | No ✓ | 79 |
📈 Charts
Maximum Generator-Only Sustainable Speed
Power Demand vs Generator Capacity
MPGe Efficiency Comparison
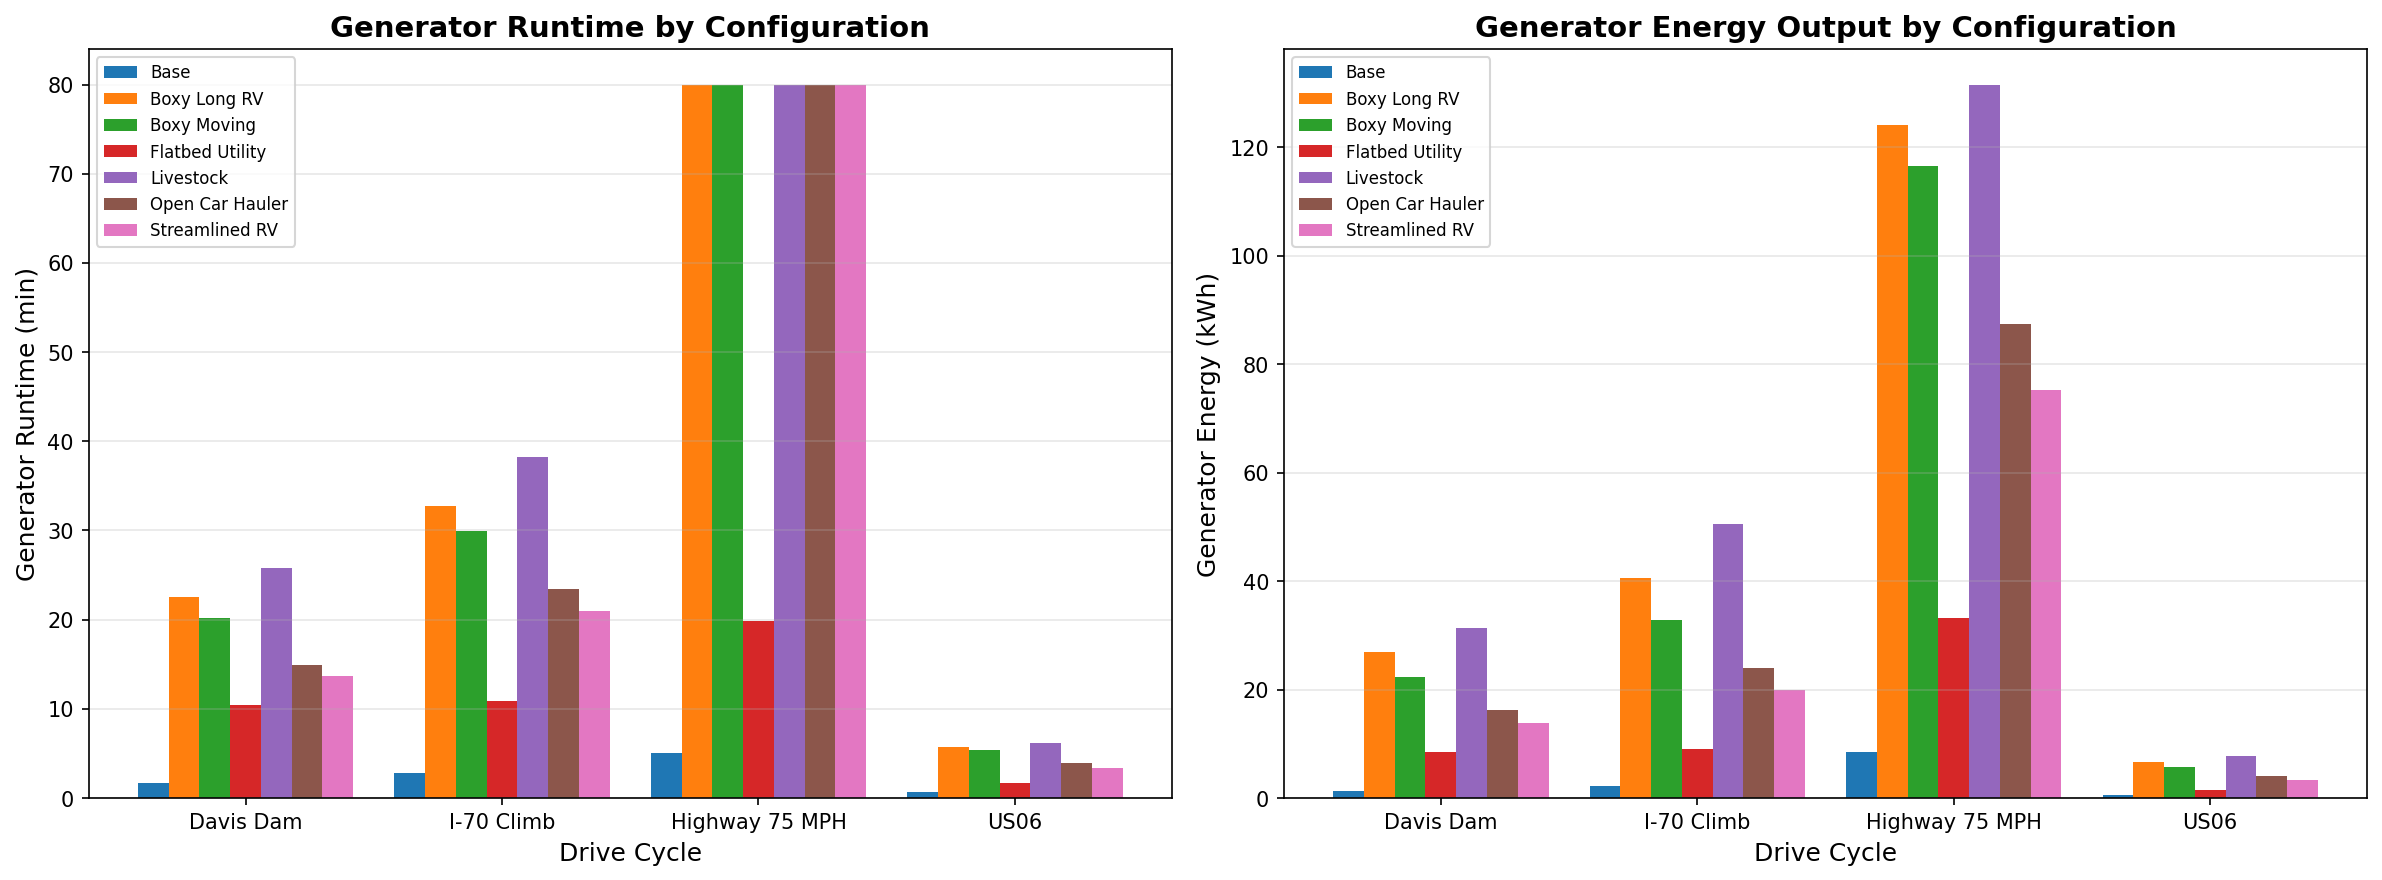
Generator Utilization
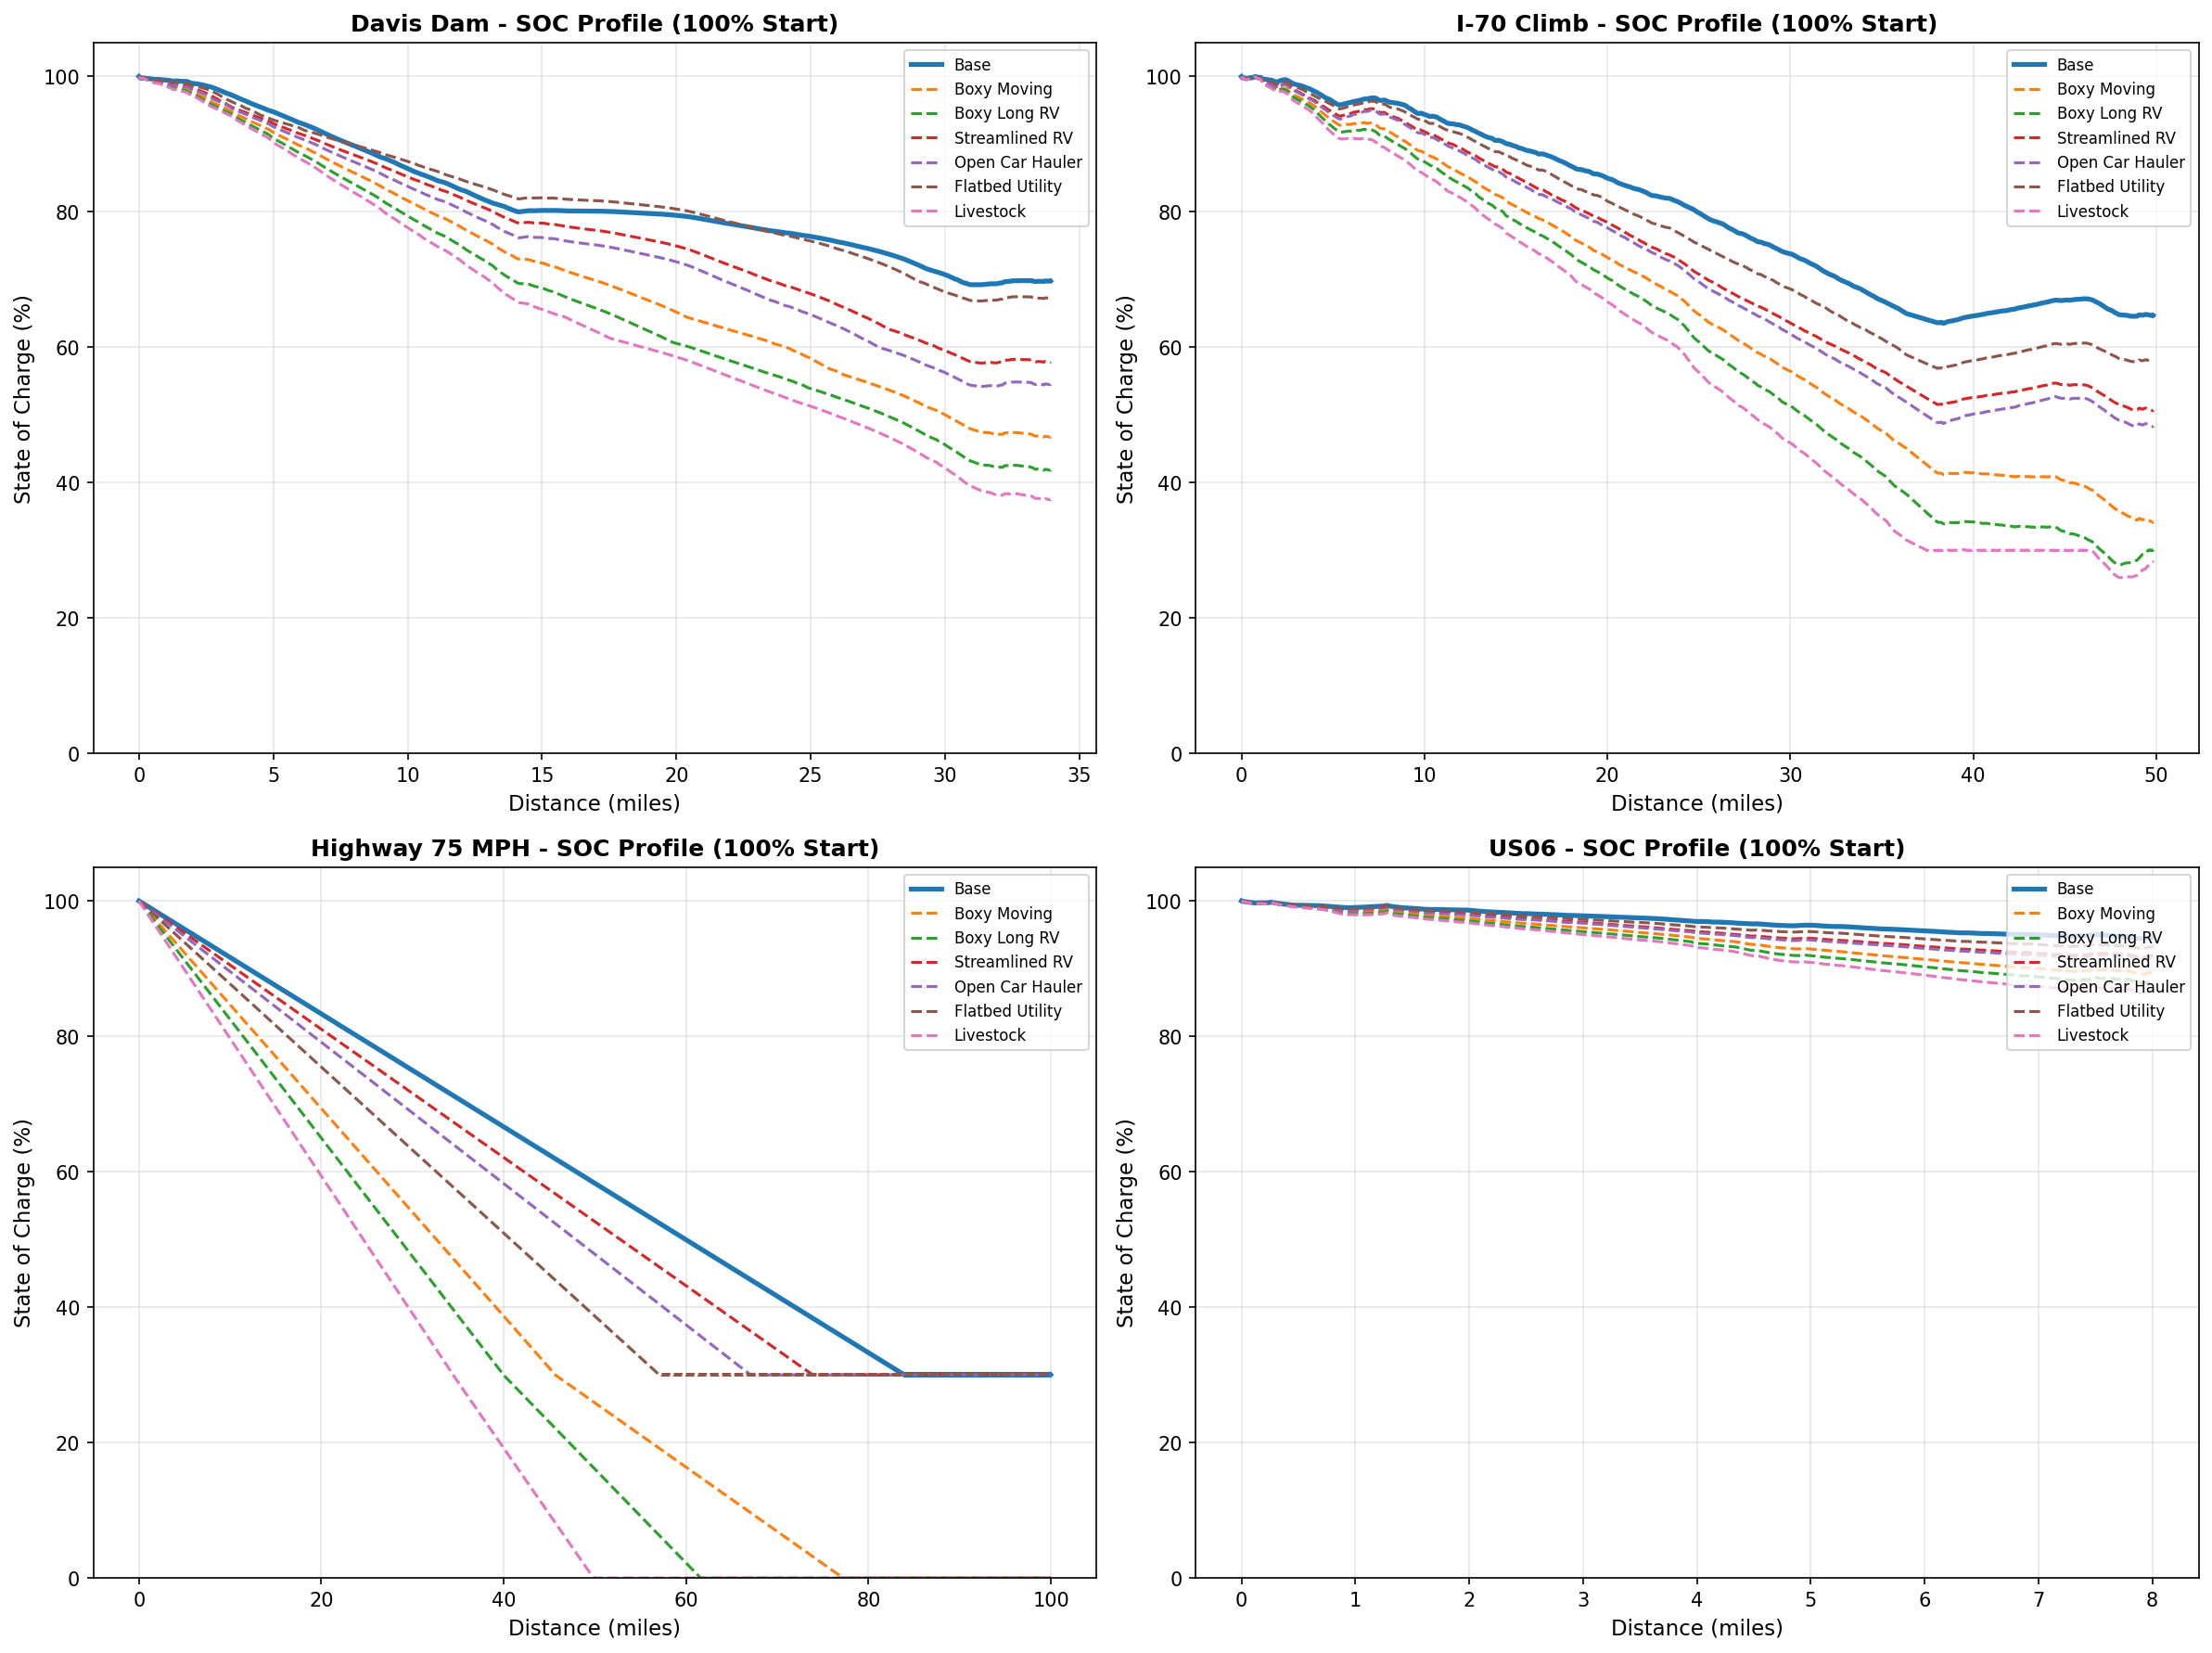
SOC Profiles by Drive Cycle (100% SOC Start)
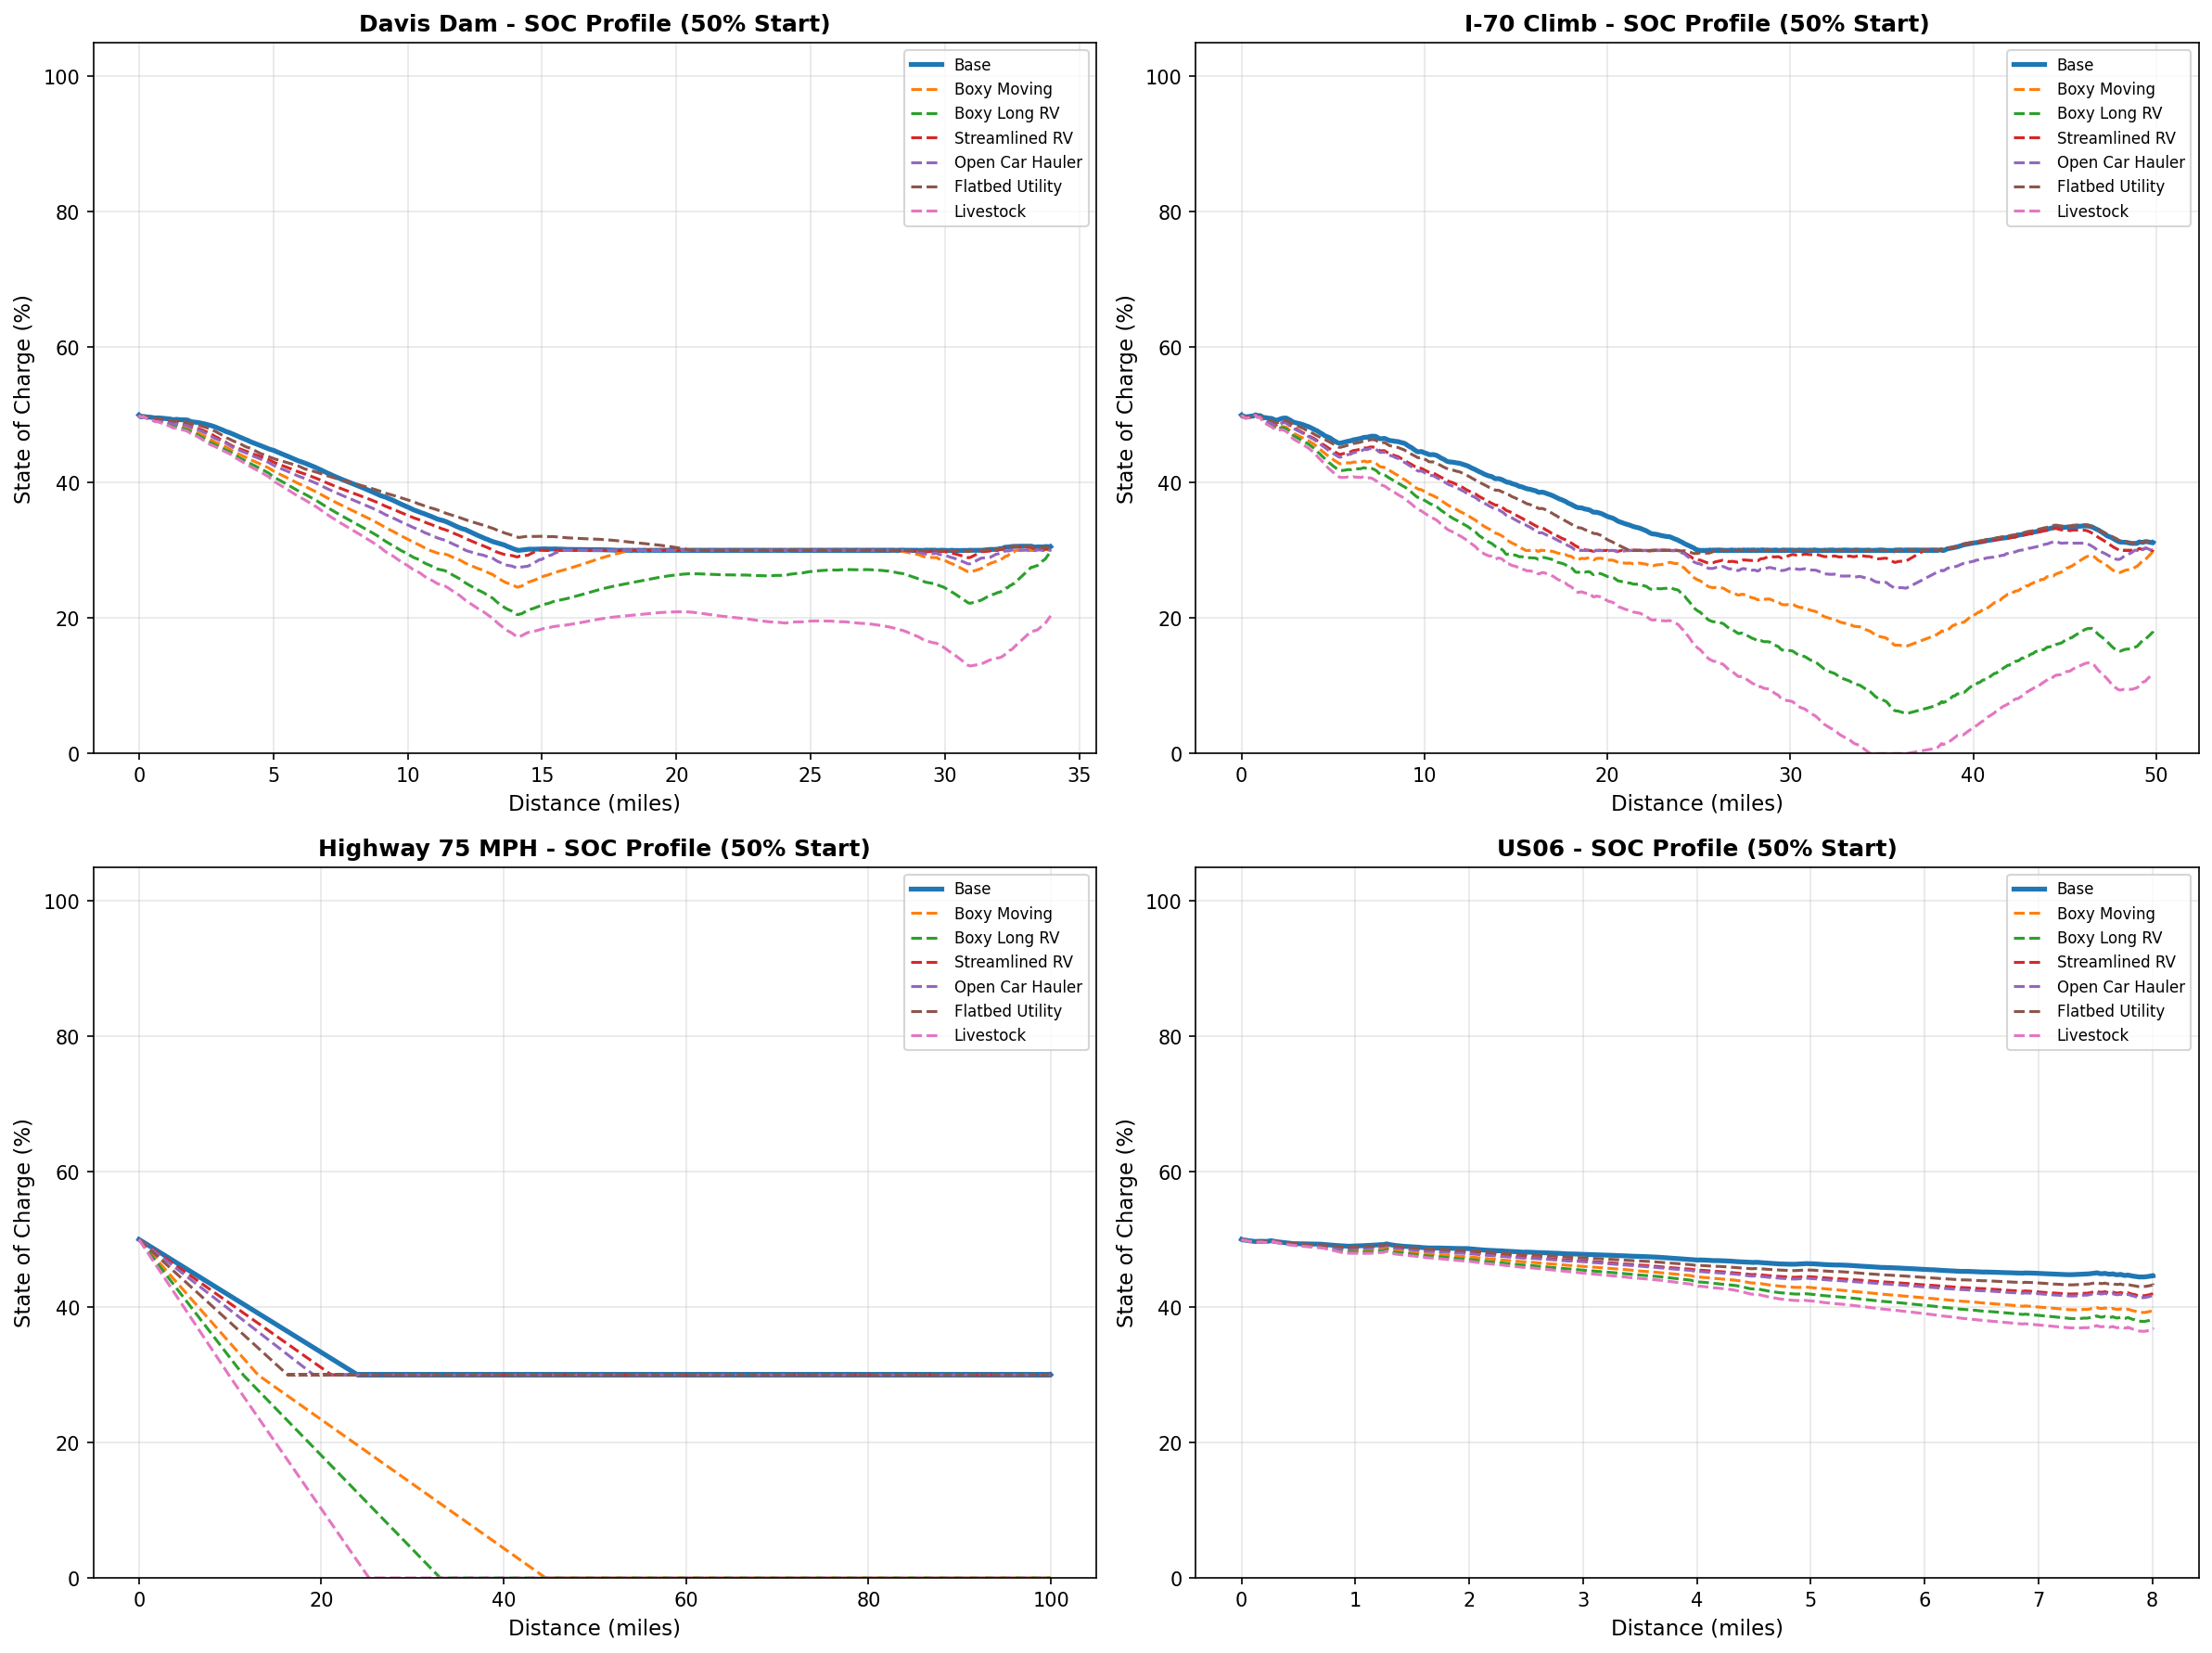
SOC Profiles by Drive Cycle (50% SOC Start)
Multi-Cycle Range Comparison